
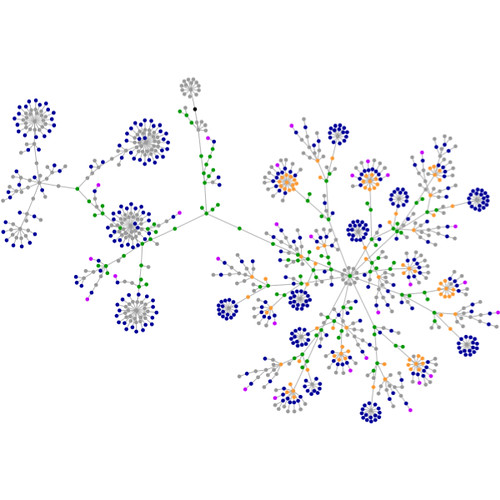
Visualizing a website can be an extremely complicated and time consuming task. The image above is a graphic representation of MUHSASHUM created by using this applet designed by Sala. This really neat java applet allows anyone to enter in a domain address for visualization, depending on the complexity of the site, it can take some time to load... so be patient. ;)
Here's a breakdown of what the colored dots mean:
blue: for links (the A tag)
red: for tables (TABLE, TR and TD tags)
green: for the DIV tag
violet: for images (the IMG tag)
yellow: for forms
(FORM, INPUT, TEXTAREA, SELECT and OPTION tags)
orange: for linebreaks and blockquotes
(BR, P, and BLOCKQUOTE tags)
black: the HTML tag, the root node
gray: all other tags...
You can view more examples at http://www.aharef.info/2006/05/websites_as_graphs.htm and if you want to try and generate your own website graph visit http://www.aharef.info/static/htmlgraph/ - enjoy!
Thanks for creating the applet Sala!
1 comment:
GREAT INFO!
Post a Comment